 Back
Back


Sneeze Bot
@TheWilsonSneeze
Above: the only profile picture and banner image ever employed by the Sneeze Bot, consisting of me at a Bell phone booth in Canada at the age of 16 or 17, and a box of Wheat Thins respectively.
Published 2025.07.20
Between August 6th, 2016, and May 23rd, 2023, I sneezed 5601 times. I know this because during that timespan I operated a Twitter account which logged the date and time of each time I sneezed. One tweet per sneeze, each containing a message like the following:
I sneezed on August 06, 2016 at 09:17AM
My first documented sneeze occurred on August 6th, 2016, at 9:17 AM, when I was 17 years old.
My last documented sneeze occurred on May 23rd, 2023, at 7:19 AM, when I was 24 years old.
The Sneeze Bot was decommissioned later that day at 1:00 PM, due to the ending of free Twitter API access. I don't recall if this was a proactive measure in anticipation of the end of the free tier for the Twitter API, or if this was simply because it stopped working. The final tweet reads:
The Sneeze Bot is dead today after 7 years due to the policy change limiting API access. Thanks for 7 great years and 5601 fabulous sneezes. The bot is no more but its legacy lives on. I'm sure I'll be reaching for my phone whenever I sneeze for years to come.
In many ways, looking back on the Sneeze Bot means looking back on Twitter itself, and what that platform meant to me. I know that it's not officially dead; it's still a real website (though they'd like you to use their new domain and call it something else) and it still technically "works" insofar as the site is (often) up and you can view the data therein. In fact, I had to do just that to retrieve the posts I reference in this article, and I'll admit, it was a strange feeling: like returning to a former home and seeing the garish decorating and poor upkeep that's occurred in the interim.
Throughout my teens and early twenties, Twitter was an important online space—for me and, it seemed, for the rest of the world. Whether true or not, to me it represented the Internet as a whole at that time, encapsulating the dynamic zeitgeist of those years. When it was taken over and subsequently rebranded, I and many others saw the writing on the wall. Witnessing its downfall may have been an interesting experience, but I'm proud to say I evacuated quickly after the takeover and hadn't been back until this point. As I recall, I logged out of my personal account some time before I stopped pressing the sneeze button.
Nowadays for social media, I use essentially only Reddit, and recently: BlueSky. I won't commit to long-term optimism about BlueSky in this semi-permanent publication, but I will say this on the platform: using BlueSky feels like traveling back in time to the Twitter of old in the best possible way. It has some minor differences but generally follows social media best practices that have long since been abandoned by the major players: it is strictly chronological, there are no ads (on the platform, that is. Accounts can and do advertise on it), and the so-called algorithm is completely optional. That, combined with its robust feature set to curate the content you see and its relatively new and enthusiastic userbase, has made it a refreshing experience with very little of the toxic addictiveness of highly algorithm-driven platforms.
Returning to the topic at hand: some sneeze facts about me: I am not typically a multiple-sneezer (in fact, just 8% of my sneezes were part of a multiple-sneeze by my generous requirement of occurring within 5 minutes of either the subsequent or preceding sneeze), and I don't have the photic sneeze reflex (the thing that makes you sneeze when you see the sun or a bright light; there's nothing in the data to show this, you'll just have to take my word for it).
The Sneeze Bot was barely even a bot; after all, tracking something like a sneeze would necessarily require someone to do something when they sneeze. It was operated via an IFTTT app called "Do Button" which allowed me to create a widget on my phone that would tweet a message automatically when I pressed it. The result of which is that throughout many of my formative young adult years, I developed the muscle memory of grabbing my phone whenever I sneeze; a habit which I still retain to this day, despite the Sneeze Bot's untimely death in 2023.
There were some flaws to this mechanism:
I attempted to compensate for these flaws by manually recording sneezes that occurred during known spans of time when I couldn't reach the Internet, which I later posted manually when I had access to Twitter. The most notable instances of this were when I was vacationing at my family's cottage in Northern Wisconsin where I didn't receive cell service.
Even back then, I considered how I could expand on this idea. Some of my ideas were:
I never did get around to implementing any of those ideas, though there's nothing stopping me reviving it. The concept of a physical device to record the sneezes was flawed, but with the technology available almost a decade later, a much more obvious answer presents itself: the clear choice of form factor for a Sneeze Button in 2025 is a smart watch: discreet, wearable, and readily available as a consumer device with the ability to load custom software. The only issue is my proclivity towards traditional watches and an aversion to their "smart" incarnation. At a minimum, having a Sneeze Watch would require me to wear two watches every day which I'm not enthusiastic about.
The total time range of the results is from August 2016 to May 2023, during which I sneezed a total of 5601 times. For most of my unscientific analysis, I'm going to "trim the edges" off that data and look at only the complete years of 2017-2022: this is necessary to break down the results by year or by month and also eliminates any irregularities from the start of the project or the chaos that was Twitter in 2023.
In those complete years, I sneezed a total of 4861 times, or an average of 810 times per year, 67.5 times per month, or 2.2 times per day.
There is of course, some margin of error in the data; it is almost certainly a slight underestimation, due to the fallibility of the technologies and methodologies employed.
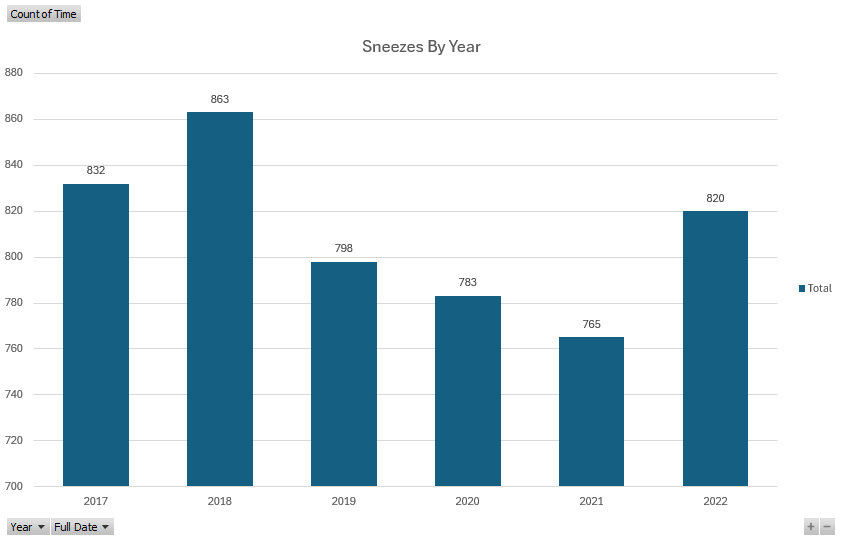
Breaking down the sneezes by year, we can see a fairly small variance in year-over-year value, with all the counts occupying a 98-sneeze range from 765 to 863.
| Year | Sneeze Count |
|---|---|
| 2017 | 832 |
| 2018 | 863 |
| 2019 | 798 |
| 2020 | 783 |
| 2021 | 765 |
| 2022 | 820 |
| Average | 810 |
As expected, only minor differences occurred year over year in terms of my number of sneezes. The sneeziest year was 2018 (863 sneezes, 2.36 a day), and the least sneezy year was 2021 (765, just 2.1 sneezes a day); a difference of 98 sneezes, or an 11% reduction. Where did those nearly one hundred sneezes go? I will speculate a bit.
Anyone you ask will likely agree that the defining aspect of 2021 was the COVID-19 pandemic. It arrived in March of 2020 (2020 is in second place for least-sneezy year, with 783 sneezes), but the response to it, which consisted of masking and social distancing, was ongoing throughout 2021. This meant not only less exposure to respiratory disease, but also less exposure to environmental factors like dust that might induce sneezing. We were dedicated to wearing masks in public throughout 2021 and didn't have much social contact with people outside our household. The end result was that I don't think I had a single cold during 2021. I would speculate that the average cold produces at least 50 sneezes, and that I typically get a cold once or twice a year; ergo, a year without colds produces a deficit of 100 sneezes. Regrettably, I didn't track periods of illness to calculate the average number of sneezes per cold (and sneezes per cold above average, as there's a certain number of "background sneezes" you'd want to factor out), though I do potentially have the means to corroborate that information via our audio journal, the Pandemic Tapes (a topic I'd love to get into in a later article).
On the other hand, we must consider the alternative that fewer sneezes could also be attributed to methodological flaws: service outages, dead zones, lack of opportunity to press the button; however, I think given my lifestyle at the time as a certifiable socially isolated homebody, it's more likely that technical difficulties stole more sneezes from the records of 2017-2019, which would only widen the gap between those years. Anecdotally, I would estimate I only ever missed a handful of sneezes a year, since I was fairly meticulous about recording them.
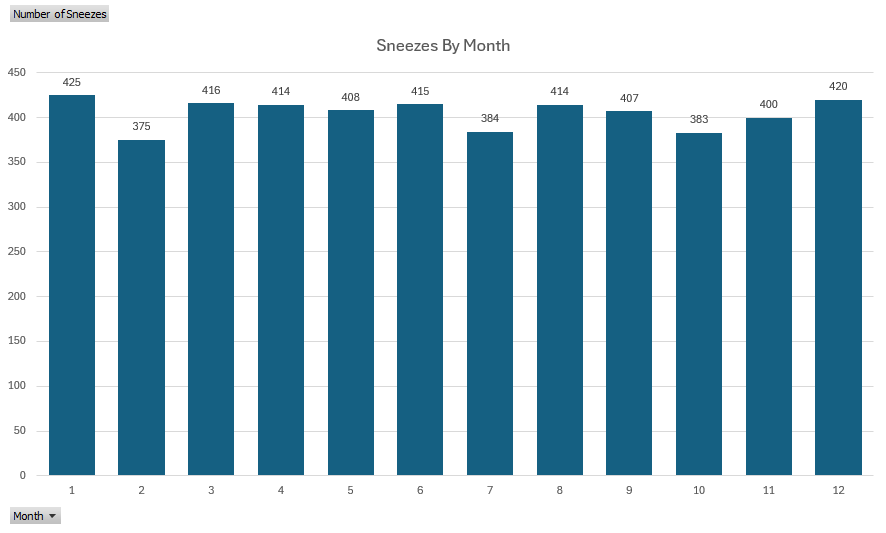
Months are an irregular and artificial construct, dividing the year into uneven sections. As such, the month with the fewest sneezes on the books would logically be February, and it upon investigation is, with only 375 sneezes across the 6 full years of data, versus the 425 sneezes of January, our sneeziest calendar month.
| Month | Number of Sneezes |
|---|---|
| January | 425 |
| February | 375 |
| March | 416 |
| April | 414 |
| May | 408 |
| June | 415 |
| July | 384 |
| August | 414 |
| September | 407 |
| October | 383 |
| November | 400 |
| December | 420 |
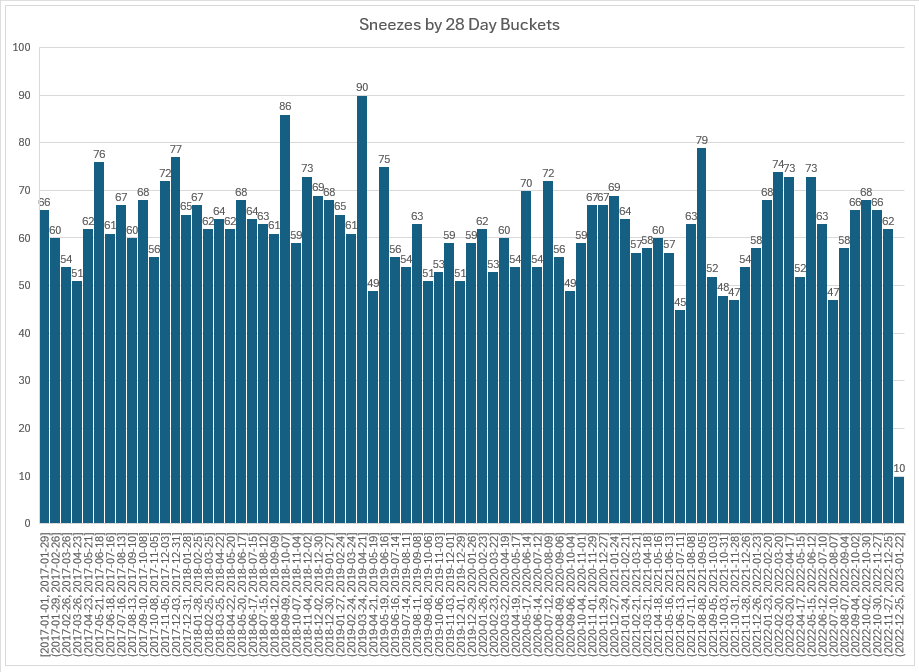
Instead, you could look at sneezes within 28-day buckets to get an idea of different timespans' sneezes. That's a more interesting graph, but kind of all-over-the-place and with no obvious trends either. The sneeziest period on this graph is March 24th to April 21st of 2019. Allergy season, I guess.
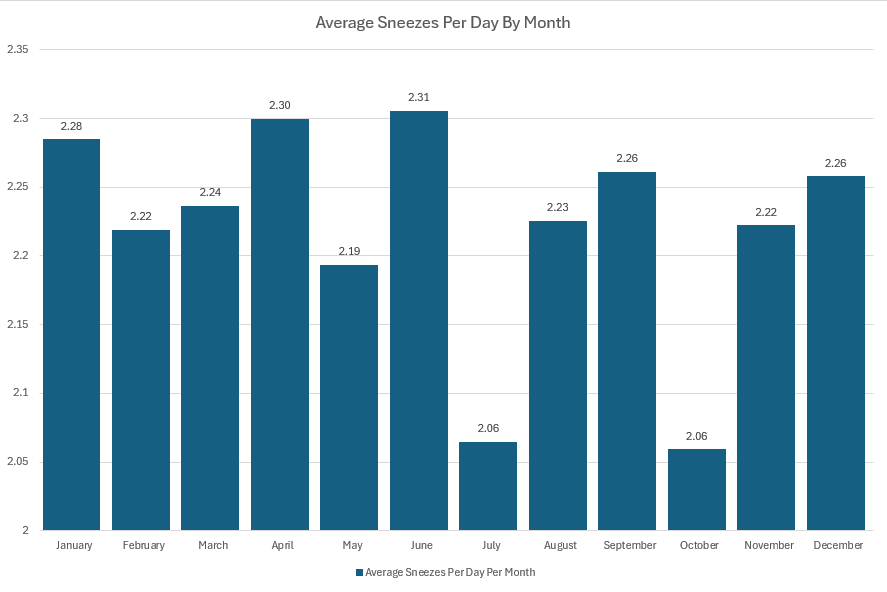
If you really want to line it up with calendar months, you can divide the totals by month by the number of days in each month to look at the sneezes per day for each month. This dataset had 1 leap year our of 6 years total, so we'll call that 28.167 days in February. That gives us the somewhat arcane, but hypothetically interesting Average Number of Sneezes Per Day In Each Month Over 6 Years. This is not the average number of sneezes per day, which you'll recall should be about 2.2, but rather the average number of sneezes within each day of a particular month, combined for all 6 years. We divide that by 6 to get the Average Number of Sneezes Per Day Per Month which will be around that 2.2 mark: the number of times you'd expect to sneeze in a given day, if it is January, for example.
Once this is done, unfortunately, the results are similarly uninteresting. It looks more or less random to me. July and October are less sneezy, with about 2.06 SPD (sneezes per day), while June just barely beats out April as the sneeziest month with an average of 2.31 SPD. There's no obvious seasonal correlation from what I can tell; what's different about June vs. July that makes June days a quarter-sneeze sneezier? It could be attributable to pollen, but I doubt it. I think there simply isn't enough data here to draw that kind of conclusion.
| Month | Number of Sneezes Per Day, Average |
|---|---|
| January | 2.28 |
| February | 2.21 |
| March | 2.23 |
| April | 2.3 |
| May | 2.19 |
| June | 2.31 |
| July | 2.06 |
| August | 2.23 |
| September | 2.26 |
| October | 2.06 |
| November | 2.22 |
| December | 2.26 |
Like anyone, I sneeze multiple times in a row occasionally. Some people almost always sneeze more than once, but I am not one of them. My methodology for recording multiple sneezes was to press the sneeze button several times, resulting in multiple tweets—as such, these typically will have the same timestamp, or at least be within a few minutes of each other. To count how many sneezes are within a single multi-sneeze, I checked if the sneeze was within five minutes of the one before or after it. What I found was that out of all 5601 sneezes, just 8% were part of a group of multiple sneezes in a row (hereafter called a "combo"), while the other 92% stood alone.
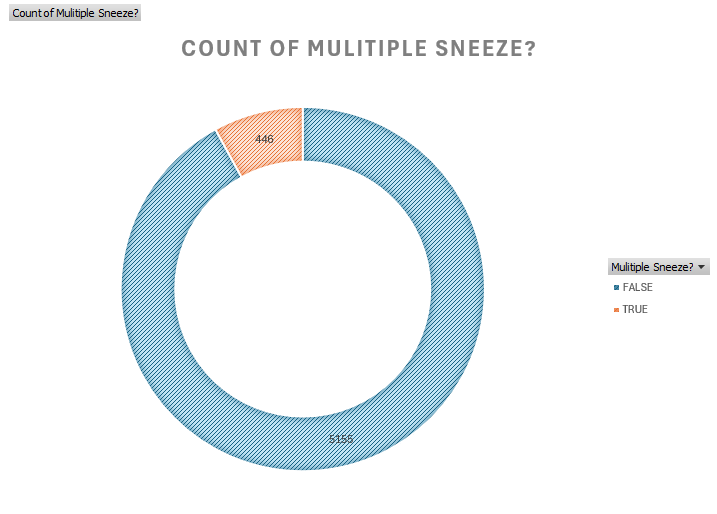
| Is Sneeze in Combo? | Count |
|---|---|
| No | 5155 (92.0%) |
| Yes | 446 (8.0%) |
To analyze the combos, I added a few calculation fields to my spreadsheet, implementing an algorithm to find and count the sneeze batches. The formulas can be viewed in action in the full documentation available at the end of the article, but they work like this:
As an aside, I love defining simple algorithms in a table like this, where you can see each of the steps in its own column. You could do it in Excel in one gigantic mess of a nested function, or you could write a script in your language of choice to do this in a nice, readable way; But I find that doing it this way is often the easiest way to show your work and quickly arrive at the answer you're looking for. Some developers balk at the idea of ever using a spreadsheet, but if you need to knock out some work with some data quickly in a visible way, it's hard to beat them.
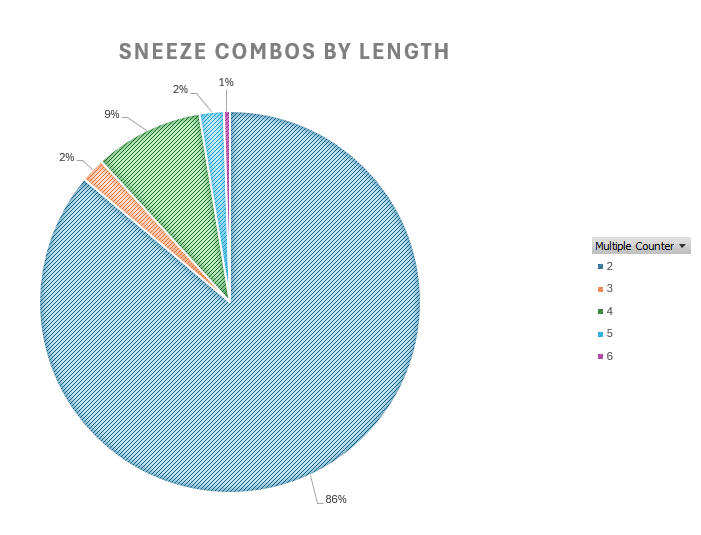
| Combo Length | Instance Count |
|---|---|
| 2 | 168 (86.1% of combos) |
| 3 | 4 (2.1% of combos) |
| 4 | 18 (9.2% of combos) |
| 5 | 4 (2.1% of combos) |
| 6 | 1 (.5% of combos) |
| Total Combos | 195 (If considered as a single unit, 3.8% of all sneezes were combos) |
My longest combo of sneezes was on November 14th, 2018, when I sneezed 6 times in a row at 9:18 AM. That was the only sextuple sneeze during my whole experiment, but I had 4 quintuple sneezes.
As expected, the largest set of combos are the two-sneezers. The quirk here is that the three-sneezer and the five-sneezer are equally rare, while the four-sneezer is inexplicably prevalent, having occurred 18 times over the course of the experiment. For this, I can offer no explanation other than a subconsious preference for even numbers.
I think this dataset, collected by one man over just a few years, offers little insight in the way of trends over time. There's nothing particularly interesting to be gleaned from the month-over-month or year-over-year sneeze counts, and any extrapolation from that data is pretty dubious.
On the other hand, it offers very consistent insight into my daily sneezing habits. My sneeze rate is fairly consistent, and it's interesting to get an idea of how often my sneezes come in multiples.
Reflecting back on the time I spent logging every sneeze, I'm struck by two things:
Is this article the final legacy of the Sneeze Bot? It's entirely possible I'll bring it back some day in another space, with different tools. Even if I do bring it back, there will be a gap in the data between the downfall of Twitter and the rise of that which comes after.
All the data from the Sneeze Bot is available for download here:
Excel Download (with charts and calculations)
Please contact me if you would like to use the data for anything, have any ideas for further analysis, or have been inspired to make your own Sneeze Bot or something like it.